Dashboards and reports

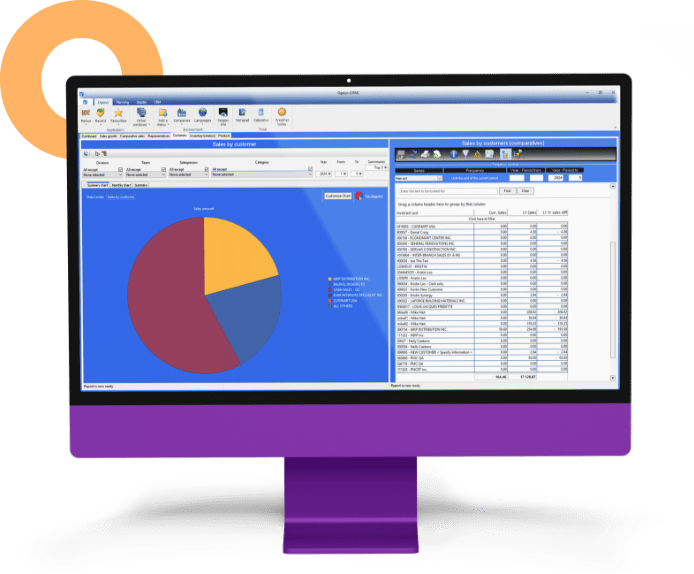
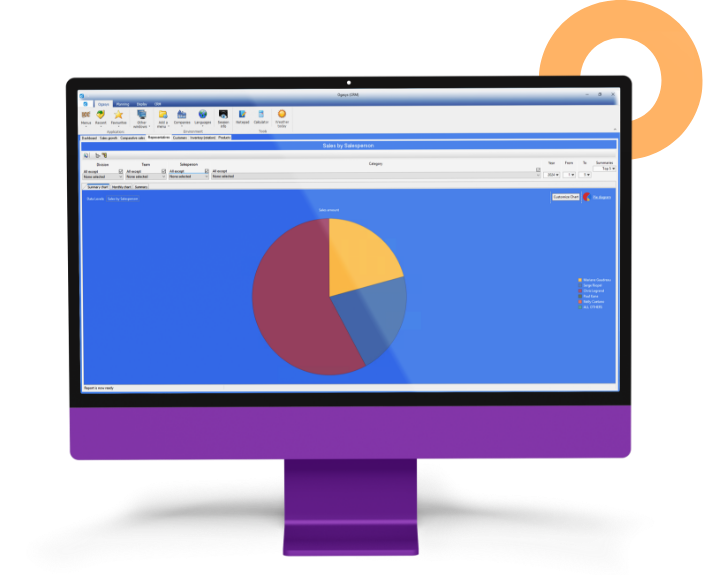
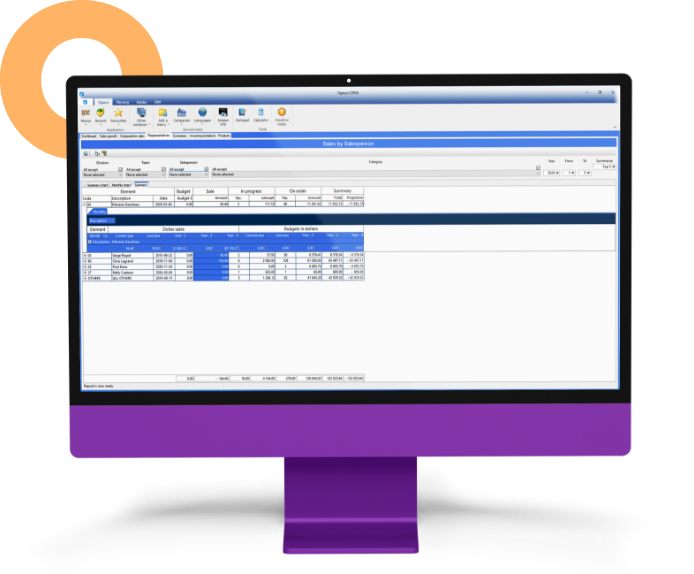
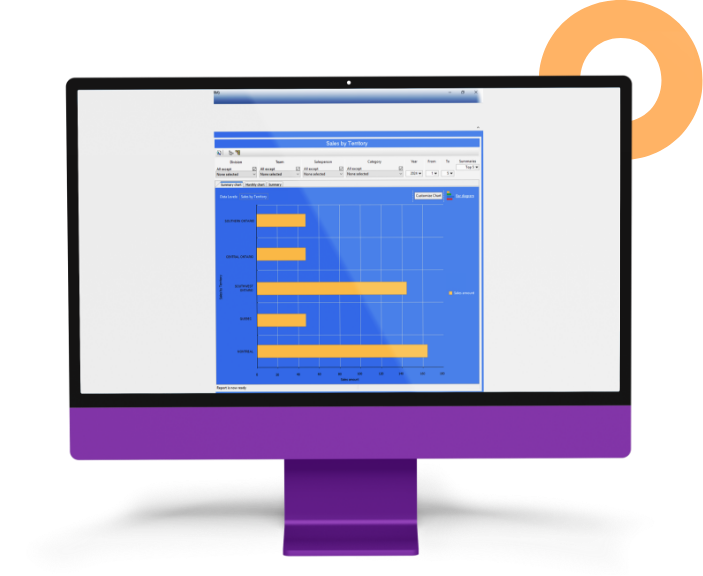
The solution provides access to different views and reports to obtain information on your company’s key performance indicators to ensure you’re running a highly optimized and streamlined business. Operational visibility is one of the reasons why many companies implement an ERP system.

Dashboard and report

Visualize the data

Connect and view your data in minutes using the intuitive dashboard, allowing you to quickly focus on what matters.

Focus your attention and resources effectively where it counts by creating ABC analysis scenarios and charts to optimize your inventory.

Get a quick overview of your inventory turnover and gross margin rate. Avoid shortages and overstocks by relying on detailed information from the Dashboard option.

See valuation, cost, margins and stock quantities instantly for each product.

Optimize planning, purchasing and marketing decisions with more in-depth data and advanced filters in your dashboard display.

Analyze the data

With everything you need in one place, easily analyze data for actionable insights.

Mining data for detailed analysis has never been easier. Spend less time in spreadsheets extracting data from outdated reports and invest it strategically using real-time metrics.

Choose any period to analyze (year, quarter, week, day) and compare it to the previous period or your budget data.

Select a store, category or customer group and get in-depth data to clarify certain situations. Export your data to Excel or any other tool in one click for additional analysis.

Dashboard and report

Spot trends

Make informed decisions by instantly spotting trends that can reveal risky opportunities and situations.

Track sales trends to stay ahead of your competitors. Ensure the satisfaction of your customers and ensure that the products they are most interested in are available in sufficient quantities and are priced appropriately.

Gain actionable insights by analyzing sales trends using key ratios and performance indicators. Uncover trends that might have been missed by standard reporting tools.

Access in-depth sales data for a specific product or location for strategic planning purposes.

Worker Worker Worker Negociator Director Cashier Accountant

Ogasys,
The all-in-one ERP solution!

Request a demo

Track KPIs

Track your goals and compare them with your key performance indicators (KPIs).

The Dashboard option combines tracking and analytics in a single platform to help you make real-time adjustments based on your data to improve performance.

Achieve your goals based on your KPIs and have confidence in your ability to make quick decisions based on your own data.

Dashboard and report

Visit our support page

Ogasys, the all-in-one solution

    Request a demo